Product interactions place demands on the users’ capabilities. Users may be excluded from using a product if any of its demands are higher than their capabilities. For example, a product with very small text requires a high level of vision capability. People with age-related long sightedness will be excluded from its use.
This page explains how to assess the demands that a product places on various user capabilities. These demand ratings can be used together with survey data to estimate the proportion of the population who would be excluded from using a product.
On this page:
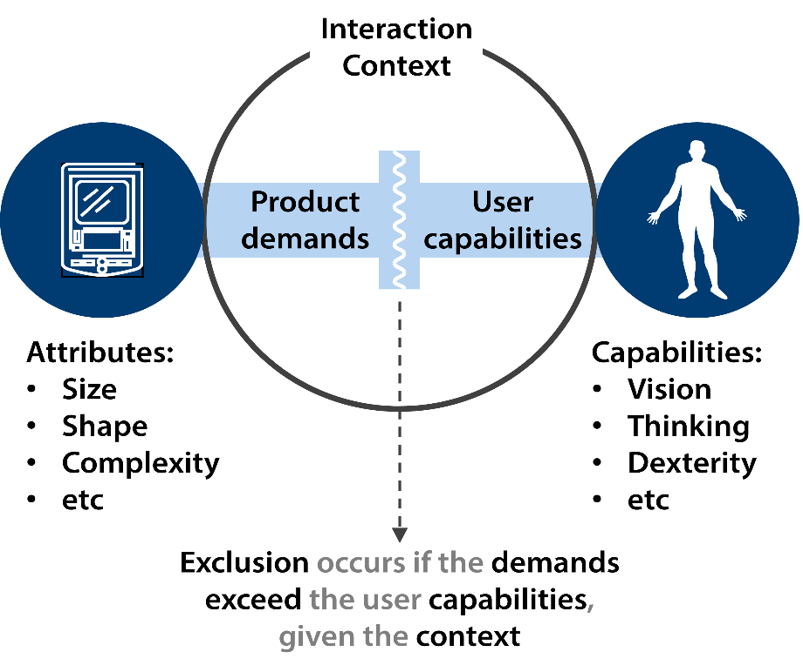
A product places demands on users’ capabilities. Users will be excluded from using the product if any of the demands are higher than their capabilities.
Introduction to assessing demand
An initial assessment can be made by rating the demand on each capability on a scale from Low to High. To do this, there are various factors that should be considered:
- For Vision, consider the size, shape, contrast, colour and placement of the graphical and text elements.
- For Hearing, consider the volume, pitch, clarity and location of sounds produced by the product.
- For Thinking, consider how much demand the product places on a user’s memory, how much it helps the user to interpret its interface, how much attention it demands, and how much prior experience it assumes.
- For Reach and Dexterity, consider the forces, movements and types of grip required to use the product. The demands will increase if tasks have to be performed with the hands reached above the head or below the waist.
- For Mobility, consider whether the product requires the user to move around. If designing an environment or service, consider whether it provides suitable features to assist balance and support mobility aids.
More information about each of these factors can be found by following the links above.
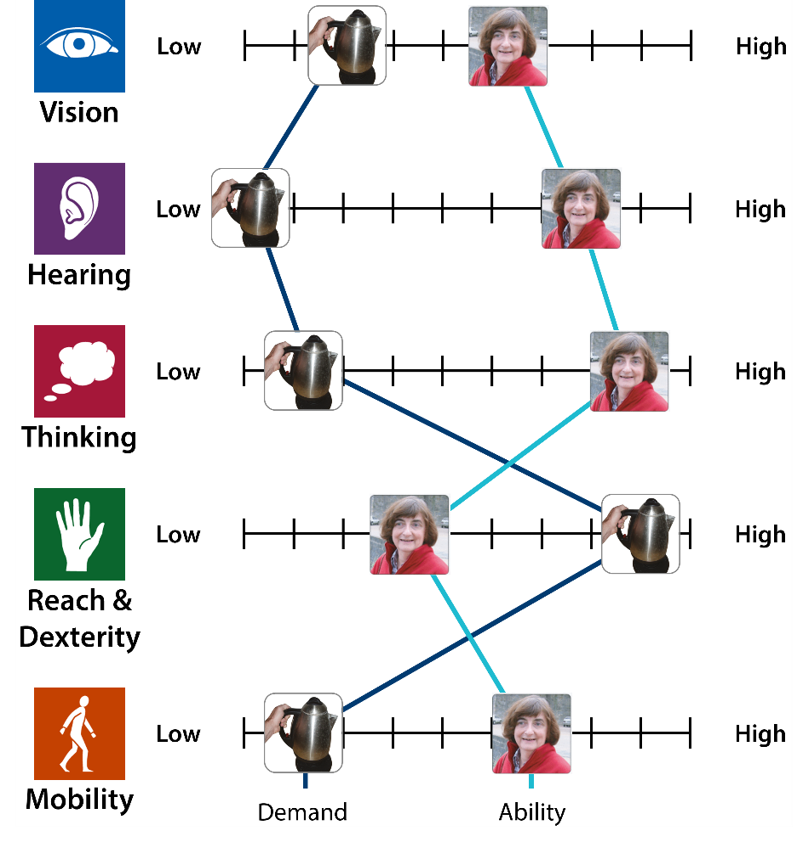
The level of demand that a product places on various capabilities can be assessed. This can be compared with the ability of the users in the target population. In this example, the product demand for reach and dexterity is higher than the ability of the example user.
Data on capability variation
Data is available on how many people in the British population have different levels of capability. This data can be used to calculate how many people would be excluded by a product with a particular set of demands.
The 1996/97 Family Resources Survey was commissioned by the UK government to provide statistics about households in Great Britain. In the same years, the Disability Follow-up to the Family Resources Survey (Grundy et al, 1999) was performed in order to help plan welfare support for disabled people. All statistics reported from this survey are percentages of the Great British adult population living in private households, which was 43.3 million people at the time of the survey.
This population-level survey collected data on all five capability categories described in the overview page, namely: Vision, Hearing, Thinking, Reach & Dexterity and Mobility. Data of this kind is important for considering multiple capability losses. Further research aims to produce a population-level survey collecting more up-to-date data that is more targeted at product interaction. Until then, the Disability Follow-up Survey remains the best source of coherent data for estimating design exclusion. Detailed prevalence statistics from this survey are available in Waller et al. (2010) and Waller et al. (2013).
This survey data indicates that 18.8% of the population have less than full capability in one or more categories. 5.3% of the population have a severe capability loss of some kind. Of these, the large majority (4.4% of the total population) have capability losses in more than one category. For Vision, a severe loss corresponds to not being able to recognise a friend at arm’s length, while for Hearing it means not being able to follow a TV programme with the volume turned up. Full definitions for all the capabilities can be found in Waller et al (2010b).
Even more people (13.2% of the population) have a moderate capability loss. For Vision this corresponds to difficulty reading ordinary newsprint, while for Hearing it means having difficulty following a conversation against background noise. Such levels of capability loss are likely to have a significant impact on the ability to use everyday products and services. In fact, 7% of the total population have moderate ability losses in more than one capability category.
These figures indicate that capability loss affects a significant part of the population. Moreover, capability losses are often combined, meaning that it is important to consider the combination of capabilities required to use a product, and not merely examine each capability in isolation.
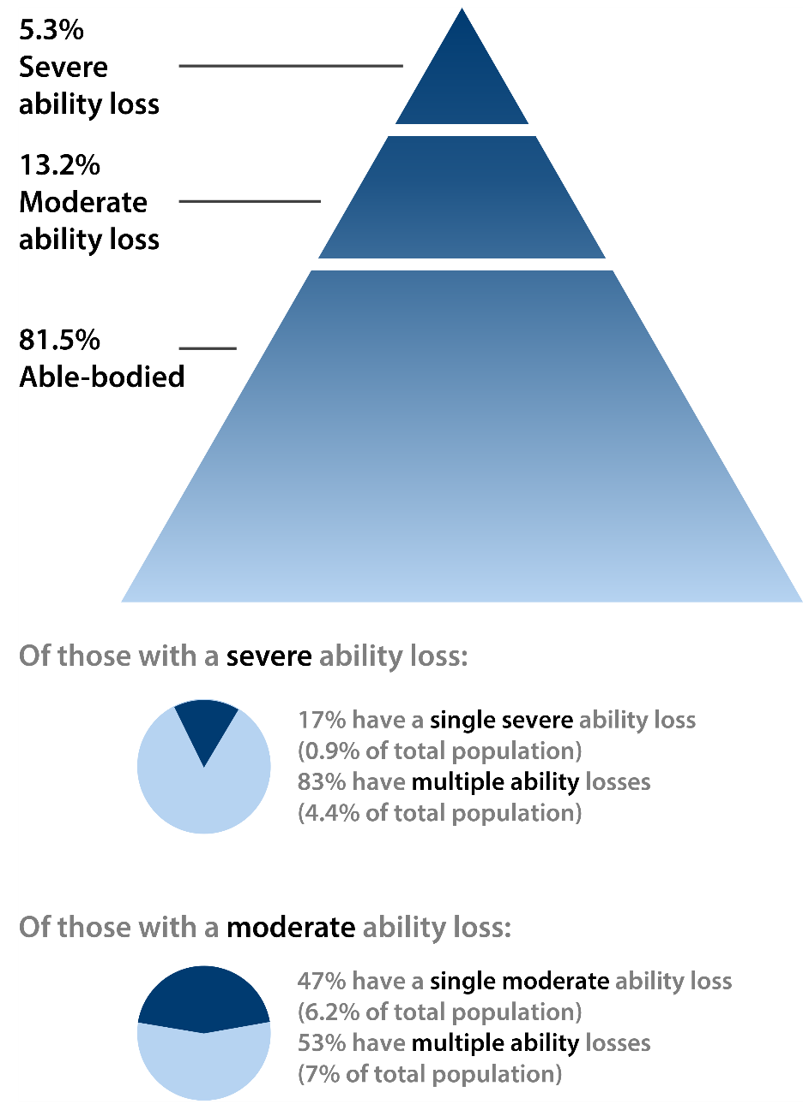
A pyramid can be used to visualise the number of people with severe and moderate ability loss in the population. A majority of those with an ability loss have multiple ability losses. Reproduced from Waller et al. (2010) with permission.
References
- A book by Grundy E at al (1999): ‘Research report 94: Disability in Great Britain’ gives details of the Disability Follow-up Survey. Published by Corporate Document Services, London
- A paper by Waller et al (2010): ‘Understanding the co-occurrence of ability loss’ presents figures for the numbers of people with multiple capability losses. Published by Springer in Langdon et al (eds.) Designing inclusive interactions.
- A paper by Waller et al (2010b): ‘Designing a more inclusive world’ gives full definitions of severe and moderate capability loss in the diagrams on this page. Published by Emerald Insight in the Journal of Integrated Care 18(4).
- A paper by Waller et al (2013): ‘Visualising the number of people who cannot perform tasks related to product interaction’ provides further prevalence statistics from this survey. Published by Springer in Universal Access in the Information Society, May 2013. Download PDF.
Assessing demand and calculating exclusion
This survey data can be linked to demand assessments to estimate how many people would be excluded from using a product. To do this, pre-defined scales are used for assessing the product demands. The scales have been constructed based on the questions in the Disability Follow-Up to the 1996/97 Family Resources Survey.
The survey asked participants questions about whether they could perform certain tasks, e.g. ‘Can you see well enough to read a newspaper headline?’. These tasks were then arranged into ordered scales, such as the one shown here. Some of the capability categories have several scales. For example, the category ‘Reach & Dexterity’ has scales dealing with strength, dexterity, reaching forward and up, and reaching down.
To assess a product, assessors consider each scale in turn. For each, they determine the level of that capability needed in order to use the product. They compare this level of capability to each of the tasks in the survey. For example, they consider whether the vision capability needed to use the product is more or less than that required to read a newspaper headline. The resultant demands are marked on the scales.
For each demand level, the Disability Follow-up Survey can then be used to calculate the total number of people who do not have this level of ability, and will therefore be excluded. This process is automated within the Exclusion Calculator available at calc.inclusivedesigntoolkit.com.
The Disability Follow-Up Survey does not make any reference to the environment, or to fatigue caused by repeated actions. Until better data is obtained, these factors can only be accounted for by using judgement to modify the demand level appropriately.
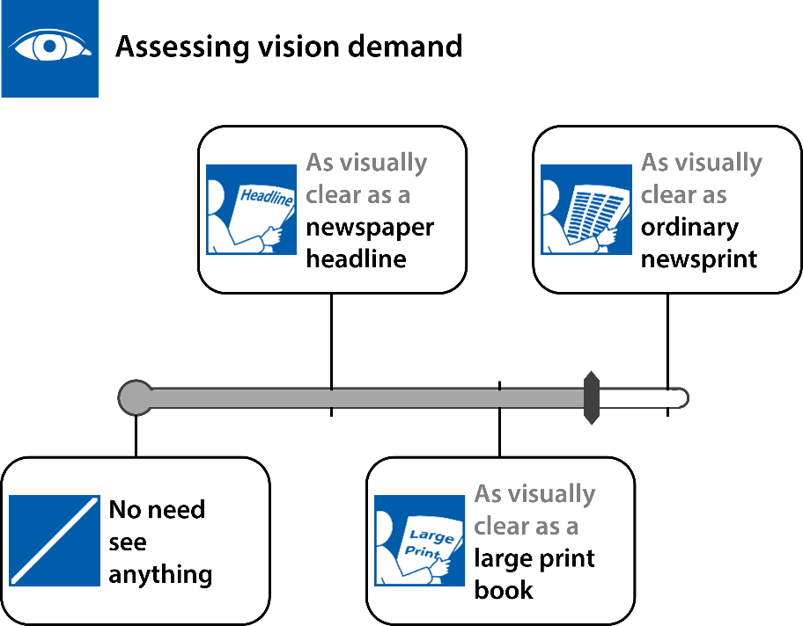
A scale for assessing vision demand based on data from the Disability Follow-up Survey.
Assessment example
This assessment method can be used to estimate the number of people who would be unable to use the kettle shown opposite. For the sake of simplicity, the results only consider vision and dexterity.
The tasks required to use the kettle were identified as: separate kettle from power source, carry to water source, fill kettle to desired level, re-attach to power source, switch on, determine when kettle has boiled and pour boiling water into mug. The level of design exclusion for an ideal kettle would be no greater than the number of people who would be unable to pick up and drink hot liquid from a mug, which is also analysed for comparison.
The capability scales were used to assess the demand level for the tasks required to use each product, then the Exclusion calculator was used to estimate the proportion of the population that would be unable to perform these tasks.
The combined number of people excluded from using the kettle (7.0%) is less than the total for each separate capability (6.5 + 0.9 = 7.4%), because some people have both low dexterity and low vision, but are counted only once in the combined exclusion estimate.
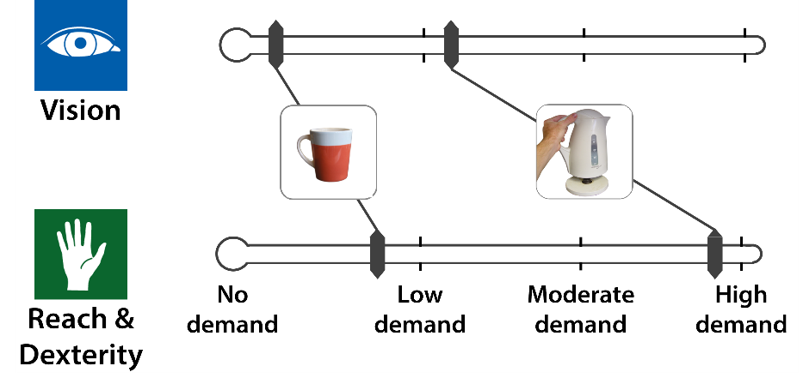
Assessment of demand levels associated with using a mug and a kettle.
| Mug | Kettle | |
|---|---|---|
| Vision | 0.4% | 0.9% |
| Dexterity | 0.5% | 6.5% |
| Combined | 0.9% | 7.0% |
Feedback
We would welcome your feedback on this page:
Privacy policy. If your feedback comments warrant follow-up communication, we will send you an email using the details you have provided. Feedback comments are anonymized and then stored on our file server. If you select the option to receive or contribute to the news bulletin, we will store your name and email address on our file server for the purposes of managing your subscription. You can unsubscribe and have your details deleted at any time, by using our Unsubscribe form. If you select the option to receive an activation code, we will store your name and email address on our fileserver indefinitely. This information will only be used to contact you for the specific purpose that you have indicated; it will not be shared. We use this personal information with your consent, which you can withdraw at any time.
Read more about how we use your personal data. Any e-mails that are sent or received are stored on our mail server for up to 24 months.